Instrumentation & Techniques
Cutting-edge instrumentation keeps us at the forefront.
We’ve spent years and millions of dollars investing in cutting-edge instrumentation for our state-of-the-art facility. Our technology suite provides our scientists the ability to conduct FTIR, SEM-EDS, HIAC, Raman spectroscopy, Raman chemical imaging, and more. When coupled with automated techniques, our productivity per expert hits levels that other labs just can’t come close to.
Fourier Transform Infrared Spectroscopy (FTIR)
FTIR is used to identify primarily organic compounds, such as polymers. Samples are presented with IR energy, and the signals generated (based on a material’s unique interactions with energy) provide a molecular fingerprint (i.e. FTIR spectrum). This spectrum allows us to identify organic and some inorganic materials. At Gateway, we use FTIR microscopes, ATR (Attenuated Total Reflectance – for larger samples and surface analysis) and a large sample compartment style spectrometer.
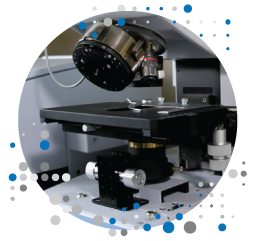
Scanning Electron Microscopy – Energy Dispersive Spectroscopy (SEM-EDS)
This analysis produces high magnification images with excellent resolution, and contrast based on chemical makeup. Additionally, EDS indicates which elements are present in the sample. The SEM is a microscope that focuses a beam of electrons onto a sample, causing the sample to emit three types of signals. The instrument has detectors that process the signals that are emitted from the sample: Backscatter electrons, Secondary electrons, and X-Rays. Gateway uses the SEM systems for:
- Manual SEM-EDS analysis for imaging/elemental information
- High resolution imaging
- AFA (Automated Feature Analysis)/automated SEM-EDS/CCSEM
- CleanCHK
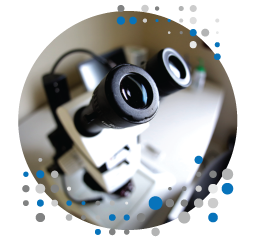
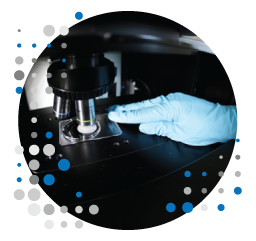
Microscopy
Microscopy is a key technique in materials analysis. Macroscopic, microscopic, and optical properties of materials provide valuable information about samples. Gateway Analytical uses the following microscopic methods:
- Stereomicroscopy
- PLM (Polarized Light Microscopy)
- Fluorescence microscopy
- Comparison microscopy
HIAC
Gateway Analytical uses a HIAC Light Obscuration particle counter to count and size particles within a liquid matrix. We can enumerate and bin particles down to 2 microns. We analyze based on both compendial (such as USP <788> and <789>) and non-compendial methods.
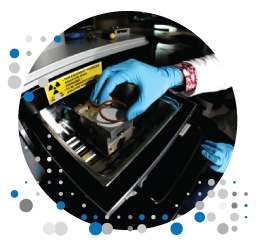
Raman Spectroscopy
Raman spectroscopy is a complimentary technique to FTIR, and can be used to identified inorganic materials such as metal oxides, minerals, and pigments that may not be identified by FTIR, as well as many organic materials such as polymers. During Raman analysis, we present a sample with a laser and examine the vibrational and rotational modes of a molecule, which give a molecular fingerprint in the form of a Raman spectrum. This spectrum allows us to identify organic and inorganic materials, examine the crystalline structure of a material, perform polymorph analysis, and much more. At Gateway, we use manual confocal Raman, Raman Chemical Imaging and automated Raman Analysis (SPE).
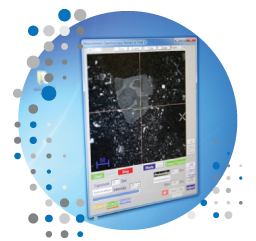
Single Particle Explorer (SPE)
The Single Particle Explorer quickly determines the size, shape, count and chemical composition of large populations of particles. The system analyzes particles down to 2 microns in size. The system combines imaging and spectroscopy (Raman and/or LIBS – Laser Induced Breakdown Spectroscopy) to provide detailed and efficient particle characterization.
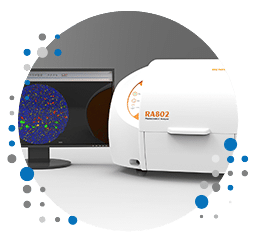
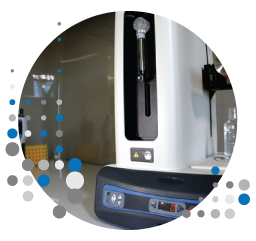
RA802 Pharmaceutical Analyser
The RA802 Pharmaceutical Analyser is a dedicated high-speed Raman system designed for pharmaceutical analysis. It can generate a comprehensive chemical images of sample surfaces in as little as 5 minutes using Renishaw’s unique LiveTrack™️ and StreamLine™️ technologies. It can be used to better understand pharmaceutical formulations to speed up drug development or perform root cause analysis. The RA802 Pharmaceutical analyser enables you to generate chemical images up to 150 times faster than conventional methods, whilst maintaining focus – ensuring pharmaceutical tablet images are of high quality. Chemical components can be highlighted by colour on Raman images and characterised using particle statistics. This gives users a tool to understand how each component is distributed throughout the sample and rationalise real-world performance between different batches and formulations.
Our 17,000 square foot facility houses all the tools required to get the answers you need.
Scanning Electron Microscopes (SEM), Single Particle Explorers (SPE), Raman Chemical Imaging (RCI), and more.
The end result is only as good as the steps taken to achieve it. See how we prepare your sample for success.
Let us help you organize your results and track your progress via our compliant and customizable database solutions.
When you meet with our analytical experts prepare to see your analytical findings, together.